


Sequim Real Estate Market Video for August 2014
The Sequim real estate market has not done anything unusual during August, and you'll see in this video that we...
The Sequim real estate market has not done anything unusual during August, and you'll see in this video that we...
There are very few first time home buyers in Sequim. The vast majority of buyers are retirees in their 50's...
The Sequim real estate market is hot, and here's why. Homes in many hot spots around the country, including California,...
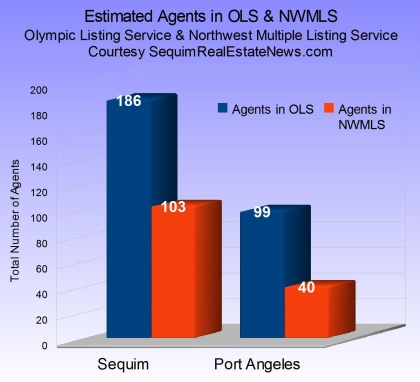
What are the prices of Sequim homes sold? And how does that compare to Port Angeles? If you're looking at...
youtubeembedcode en add-link-exchange.com
The Sequim real estate market is suddenly very hot. Buyers are here looking at homes in significant numbers, more than...
This is the Sequim Real Estate Market Report for January of 2014. youtubeembedcode pl add-link-exchange.com It's no surprise...
This Sequim real estate market report is brought to you by Chuck Marunde and Sequim & Port Angeles Real Estate....
I realize, "Why sell stock to buy a home now?" is a provocative question, but there is substance behind the...
The real estate market has been very active throughout 2013, at least up to October. Suddenly in October and so...
Is the Sequim real estate market recovering? I believe it is, and this chart is persuasive. While there are no...
The Sequim real estate market has definitely picked up for July and August. More retirees are looking, and more are...
The Sequim real estate market is hot! This is the official pronouncement by Chuck Marunde, Broker of Sequim and Port...
A client asked me some very good questions about the Sequim real estate market and whether they should buy a...
Sequim homes are selling at a substantially increased pace. I've compiled data for the first quarter of every year since...
The Sequim real estate market is in a very interesting phase right now. We have an apparent contradiction in the...
Sequim home sales have seen a substantial increase so far in 2013. In this graph you can see that in...
This is a very unusual real estate market, and it is not like any market or cycle I've seen in...
Today I want to look at what Obama's re-election means for real estate? Now that President Obama has won his...
This Sequim Real Estate Market Report reveals a very interesting view of home sales in Clallam County in the fall...
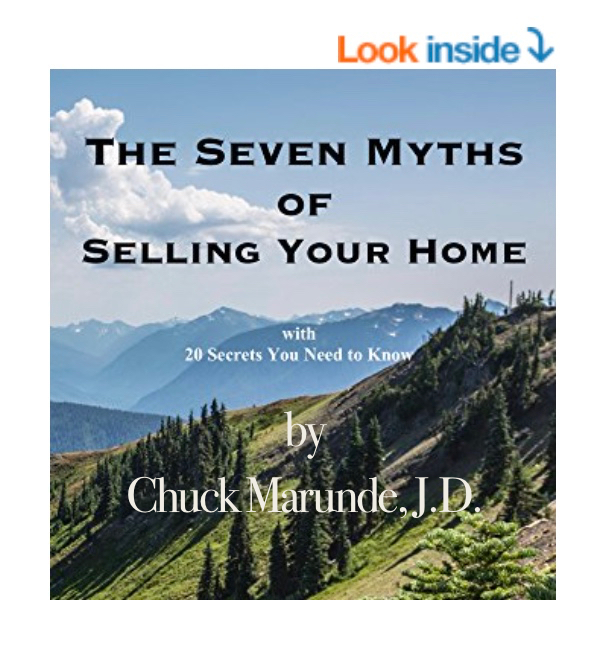
"I wish I read this before selling my
home. I could have saved $50,000." Andy

The largest independent real estate blog in the State of Washington with over 2,200 articles totally focused on our client’s best interest, their needs and their curiosity. All free and 100% reliable. I’m here if you need me,