Land Sales 2007 in Sequim and Port Angeles
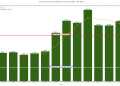
Land sales in Sequim and Port Angeles for the calendar years 2006 and 2007 are represented in this graphic. The...
Land sales in Sequim and Port Angeles for the calendar years 2006 and 2007 are represented in this graphic. The...
This chart shows lot sales each month in 2006 compared to each month in 2007 in Port Angeles and Sequim....
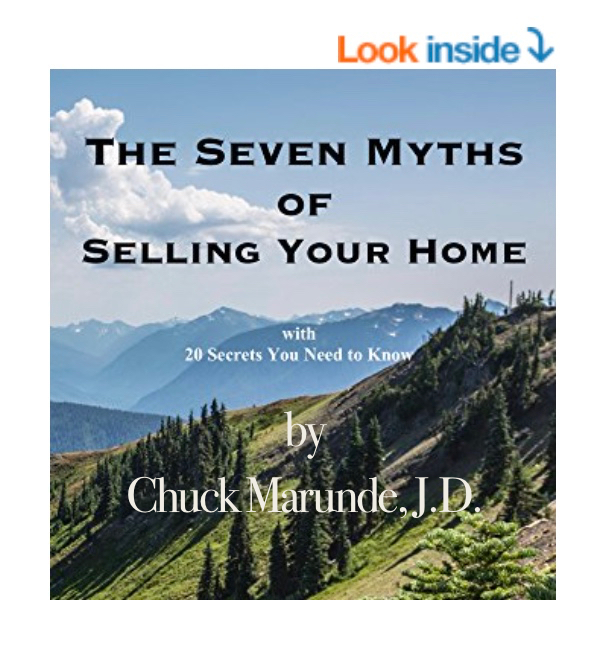
"I wish I read this before selling my
home. I could have saved $50,000." Andy

The largest independent real estate blog in the State of Washington with over 2,200 articles totally focused on our client’s best interest, their needs and their curiosity. All free and 100% reliable. I’m here if you need me,