

Sequim Homes Sold Recently
Here's a review of Sequim homes sold recently. This is a little different than looking at a pie chart or...
Here's a review of Sequim homes sold recently. This is a little different than looking at a pie chart or...
This Sequim real estate market update is brought to you courtesy of Chuck Marunde, J.D., your favorite Sequim Buyer's Agent....
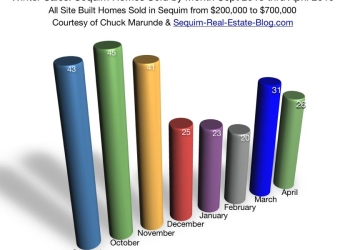
Sequim home sales in winter often confuse people, because in a small real estate market like Sequim's, and with a...

Sequim home sales have been challenging to analyze and interpret this year, and for good reasons. The market has not...

Home sales in the upper price range have many people baffled, not just buyers but also sellers, and believe it...

Sequim home sales for 2019, at least for the first 8 months (January through August) have been interesting, if not...

The Sequim real estate market has been undergoing dramatic changes in the last 24 to 36 months after a long...
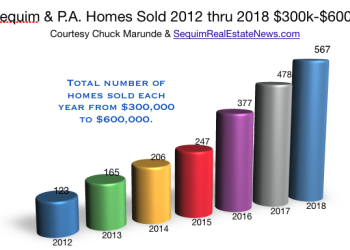
Sequim home sales over the past year tells a story, but it's a story that needs to be put in...
Pending sales are way up in Sequim and Port Angeles. We have 125 pending sales. This helps explain why buyers...
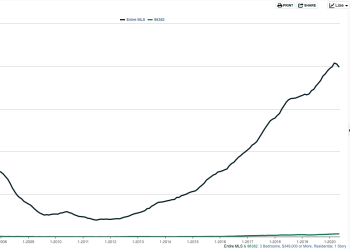
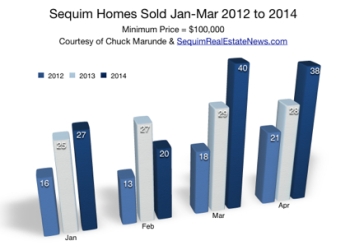
Sequim home sales have been improving, but I thought it might be helpful to see a visual aide on Sequim...
Home sales are better than they've been for 8 years according to the National Association of Realtors. The NAR reports...
The Sequim real estate market report for June of 2015 confirms the trend of an improving market, but alone this...

The Sequim housing inventory is as low as it has been in many years, and buyers arrive every day to search...
The Sequim real estate market has been doing much better this year, and as you may know from reading some...
This real estate market report for April of 2015 is brought to you by Chuck Marunde and iRealty Virtual Brokers,...
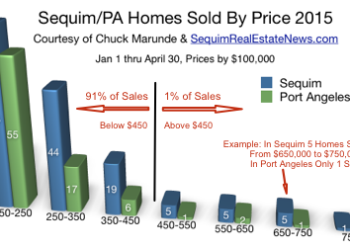
I received this question about real estate prices today, "Am curious regarding your opinion as to higher priced home sales....
The Sequim real estate market continues to slowly improve. The average days on market (DOM) was down 17% in January...
The Sequim real estate market for December 2014 is interesting. Most Decembers tend to slow down, because closings in December...
The Sequim real estate market has picked up this spring much more aggressively than in the past six years. This...
What are the prices of Sequim homes sold? And how does that compare to Port Angeles? If you're looking at...
"I wish I read this before selling my
home. I could have saved $50,000." Andy

The largest independent real estate blog in the State of Washington with over 2,200 articles totally focused on our client’s best interest, their needs and their curiosity. All free and 100% reliable. I’m here if you need me,