


Sequim Real Estate Market Report Feb 2014
youtubeembedcode en add-link-exchange.com
youtubeembedcode en add-link-exchange.com
Who is looking at Sequim homes in the winter? Many buyers are. I've been out showing Sequim homes to two...
Sequim homes are selling at a substantially increased pace. I've compiled data for the first quarter of every year since...
Sequim home sales have seen a substantial increase so far in 2013. In this graph you can see that in...
Sequim home prices are not easy to understand for buyers from out of state. When you come to look at...
Have Sequim home prices bottomed out? There's good news from around the country. One of the most widely followed measures...
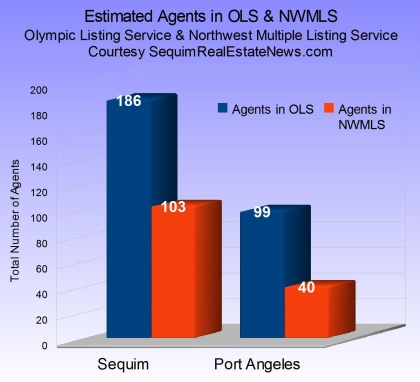
How do Sequim homes sold compare to Port Angeles homes sold during the calendar year 2012? I've organized the data...
Sequim homes sold have increased in 2012 compared to 2011. I've compiled data showing Sequim homes sold in each month...
Sequim home sales picked up in the last quarter of the year by a significant margin over the same time...
Sequim home prices may be on a slow path to normal, but dramatically increased Sequim home sales are a pretty...
This Sequim Real Estate Market Report reveals a very interesting view of home sales in Clallam County in the fall...
Sequim home sales in the first half of 2012 reveal a lot about the Sequim real estate market. I've compiled...
What have Sequim home values done before and during this recession? What is the trend for home prices in Sequim...
Are homes sales increasing around the state of Washington and in the Sequim area? The questions have come up periodically. ...
Sequim real estate sales in the first quarter of 2012 are an indication of whether the Sequim real estate market...
How many Sequim homes are under contract now? That reminds me of a couple of other popular sayings, like, "Are...
The question, "Do people buy homes in Sequim in the winter months?" came up recently, and with this recent snow,...
Homes sales were up in November nationally, but it turns out the NAR (National Association of Realtors) overstated national homes...
Home sales and home building have picked up in some areas of the country. This is good, and it bodes...
This Sequim Horse ranch has been sold. I am pleased to report that I represented the sellers, and the buyers...
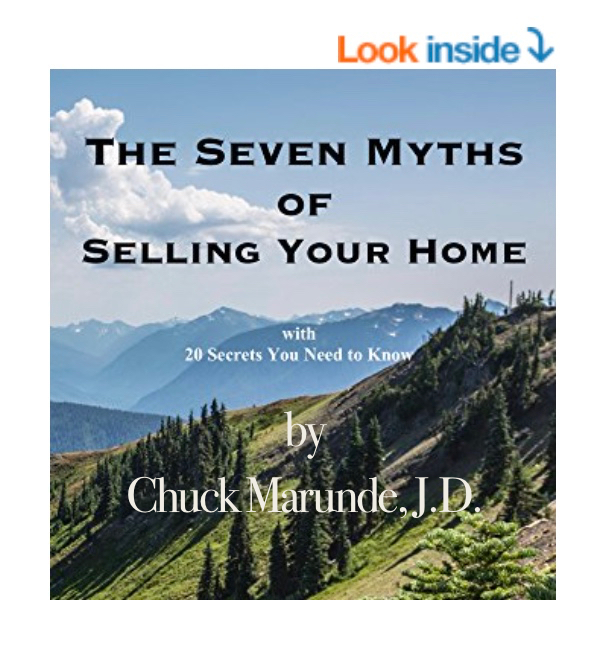
"I wish I read this before selling my
home. I could have saved $50,000." Andy

The largest independent real estate blog in the State of Washington with over 2,200 articles totally focused on our client’s best interest, their needs and their curiosity. All free and 100% reliable. I’m here if you need me,